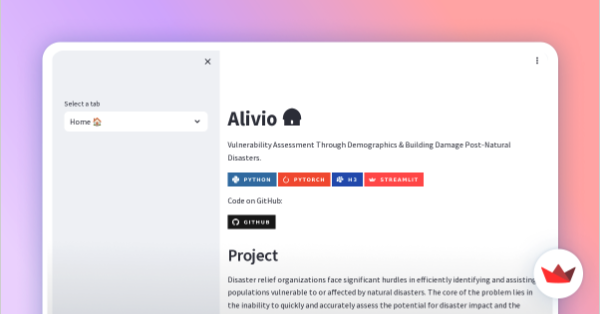
Alivio
About
Alivio aids relief workers in the event of a natural disaster by providing a Data & AI backed platform that assists them to prioritize on-ground efforts. It utilizes satellite images and geospatial data to provide reliable views and indexes on the affected areas and highlight vulnerable populations. Research suggests that climate change is increasing the frequency and intensity of natural disasters - driving up the cost of impact.
Key Components
- Web Application: This is the main interface for inspecting immediate impact after a disaster. It consists of multiple features including:
- Live Damage Classification: Building damage classification by looking at satellite images after the disaster, with annotated building geomtries as ground truth to evaluate metrics.
- Population Vulnerability Map: A heat map that highlights the most vulnerable populations in the affected area using uniform geospatial indexes.
- Live Damage Classification: Building damage classification by looking at satellite images after the disaster, with annotated building geomtries as ground truth to evaluate metrics.
This assists in highlighting the most affected areas by infrastructure - which when viewed in conjunction with demographics, can help in prioritizing relief efforts.
Data Sources
- Satellite Images: The application accepts satellite images from Sentinelhub (from the Sentinel Satellite) to provide a view of the affected areas.
- xview2 Building Damage Data: The model is trained on the xview2 dataset which contains tagged and labeled images of buildings before and after major disasters like hurricanes, volcanoes, etc. This is the primary dataset for the building damage classifier model used in the application.
- Demographics: Population densities across regions
- GDP Data: This data is used to provide a context to the vulnerable population map.
Tech Stack
All development of this project was done using the Python programming language, most of the time in a notebook interface provided by the Jupyter project. Model training occured on the cloud using AWS facilitated GPUs. The application was built using the Streamlit framework.
All code for this project is open-sourced and available on GitHub. See project links.
Model Building & Training
The core machine learning model used was the Vision Transformer (VIT). With the rise of transformer models in the last couple of years, it has been shown that they can be used for a variety of tasks - including image classification. The model was trained on the xview2 dataset to classify building damage.
Application
The application was built using the Streamlit framework. Streamlit is a great tool for quickly building data applications and visualizations.
Roadmap
Capstone was a great space for us to get a minimum viable product / proof-of-concept out there. We're grateful to the support of the United Nations World Food Program, who provided key insights and inputs when this project took off. As our core target user, we aim to continue to build and iterate on this solution with them, with a goal of having it used in the field, and provide reliable insights. Based on further input from our target user base, the following features are in the pipeline for the next few months:
- Model Improvements: Building detection model + improvements in performance of damage classifier.
- Diverse Data: Integration of more data sources to provide more context to vulnerable population grids.
- Simulation Modeling: Incorporating disaster simulation models to predict impact of hypothetical disasters.


