

 Saxenian")


Exploring the Effect of Music Written in Different Languages on Individuals’ Concentration Level: Insights from EEG Data Analysis
Exploring the Effect of Music Written in Different Languages on Individuals’ Concentration Level: Insights from EEG Data Analysis
Project Summary
This project studies the impact of music written in diverse languages on individuals’ EEG patterns when they perform tasks that demand concentration.
Project Motivation
Being a bilingual international student, I have long observed a correlation between the music I listen to and my concentration levels while working on homework assignments. I have found that my ability to focus varies when the lyrics are written in different languages. For instance, when I work on assignments written in English, Chinese songs or purely instrumental pieces seem to enhance concentration while English songs usually make it more challenging for me to focus.
This observation made me curious about its underlying mechanisms and neural basis. To better understand the relationship between language, music, and concentration, I conducted an experiment to collect and analyze my EEG data when I performed different tasks while listening to music written in various languages.
Methods: The First Iteration
I selected a list of music for the following languages (if lyrics are available).
| English | My second language and the language that I speak in academic and professional contexts. |
| Mandarin Chinese | My first language and mother tongue. |
| Japanese | I have taken an elementary Japanese course in undergrad, so I am able to partially understand some of the lyrics written in Japanese. |
| Instrumental | Having no lyrics at all |
In addition, I ensured that I have similar levels of familiarity with all the selected pieces of music. Based on personal experience, I found that familiarity with music oftentimes has an effect on my level of concentration while working on academic tasks. Therefore, I would like to minimize the effect of this factor in this experiment.
The selected music will be added to a playlist and played in the following order:
- Two English songs
- Two Mandarin Chinese songs
- Two Japanese songs
- Two instrumental pieces
The table below shows the details of the playlist used in the first iteration of this experiment.
| Title | Artist | Duration | Language | Spotify Link |
| Questions For The Universe | Laufey | 3:24 | English | https://open.spotify.com/track/7kle3wveNJelYdI1khvHDb?si=a2dee201f6d04b… |
| 9 Crimes | Damien Rice | 3:39 | English | https://open.spotify.com/track/08YEGpKt2LHJ0URCXKHEie?si=931fe81258914b… |
| 我等的那个人 | Xing Zheng | 3:59 | Chinese | https://open.spotify.com/track/36sqsukwpzgDjrBW6fOL2P?si=7f58a66caf644f… |
| 心动 | Kit Chan | 3:51 | Chinese | https://open.spotify.com/track/2DglkgKB5UlwrCdwcHZjXE?si=fef8eb173c844b… |
| カタオモイ | Aimer | 3:27 | Japanese | https://open.spotify.com/track/2HovXsvcdJur52BOcYGydz?si=054c7b941f2d4f… |
| YASASHISA | Fujii Kaze | 4:00 | Japanese | https://open.spotify.com/track/57u1FaZlztApkcT5x5XNuD?si=d7dde4d593f74e… |
| Yumeji’s Theme | Shigeru Umebayashi | 2:30 | Instrumental | https://open.spotify.com/track/0yVq58uQ2Bp2OVADYlLHNk?si=6398f9eb719e40… |
| Gymnopedie No.1 | Erik Satie, Mimosa | 3:39 | Instrumental | https://open.spotify.com/track/16AtEuLpkzUg1BLSugpHE6?si=e59d234bdfc945… |
In the first iteration, I performed the following tasks and collected my EEG signals while working on them.
| Task | Language | Detail |
| Reading a novel | English | The Committed by Viet Thanh Nguyen |
| Solving Leetcode coding problems | English, Java | All problems have a difficulty level of “Easy” |
| Writing an essay | English | Writing the technical implementation detail of my Tangible User Interfaces class project |
| Reading a novel | Chinese | Brothers by Yu Hua |
The last task of reading a Chinese novel is to investigate whether the music-induced distraction that I often experience when working on English assignments is due to my lack of proficiency in that language as compared to my mother tongue. I choose the novel reading task in particular because I think I can perform it equally well in both languages when I am not listening to music.
For each task, I completed the following steps:
- Perform the task without listening to music for 15 minutes
- Continue the task while listening to the playlist
The EEG data collected at Step 2 will be split into four groups according to the type of music being played at that time. The data will be compared with not only one another but also the data collected at Step 1.

Data Collection
In this project, I used OpenBCI’s Ganglion device to collect EEG signals.

Referring to SD. You’s research in “Classification of Relaxation and Concentration Mental States with EEG,” I decided to attach three electrodes to my forehead to collect EEG signals from my FP1, FZ and FP2 positions in the 10–20 system.

Data Interpretation
I delved into several research papers centered on EEG signals and concentration. The majority of these studies focus on changes in the Alpha (4-8 Hz), Beta (8-12 Hz), and Theta (12-30 Hz) bands when assessing an individual’s concentration state. For instance, the research conducted by Lim S., Yeo M., and Yoon G. in “Comparison between Concentration and Immersion Based on EEG Analysis” revealed that participants experienced an increase in Alpha and Theta waves during increased concentration states, and the ratio of Beta waves to Theta waves emerged as a good index to reflect participants’ concentration levels.
However, it is noteworthy that the exact correlations between concentration states and Alpha, Beta and Theta waves vary across different research papers. To enhance the interpretation of the EEG data gathered in this experiment, I decided to establish a baseline for myself using the initial segments of the recordings that were collected when no music was played in the background.
I assumed that at the outset of each recording, my concentration level would gradually increase. To analyze this progression, I divided the first section into multiple subsections and compared their power spectral density plots. This approach allowed me to see how my EEG signals evolved as I entered a state of focus. The comparison of these subsections focused on the Alpha, Beta, and Theta bands.
Failed Data Collection in the First Iteration
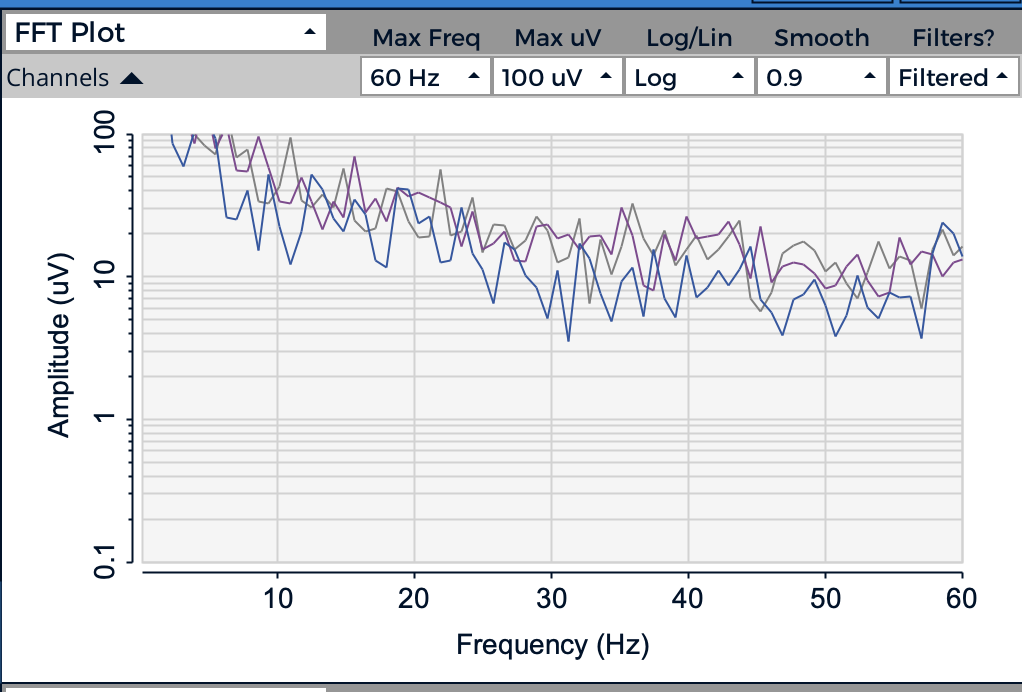
During the initial round of data collection using the OpenBCI Ganglion board, I forgot to connect the reference pin and the ground pin to my earlobes - where nodes A1 and A2 are located. As a result, the EEG signals obtained exhibited unusually large amplitudes. The example plot below illustrates these signals, with amplitudes reaching tens of thousands of microvolts, whereas typical EEG signals usually fall between -10 and 10 microvolts.

The example FFT plot below generated by the OpenBCI GUI also displays amplitudes close to or exceeding 100 microvolts.
Initially, I attributed the issue of exceedingly large amplitudes to the absence of filtering in the raw data. To address this, I applied notch filters to eliminate signals with frequencies of 50 Hz and 60 Hz, and employed a butter filter to focus on signals between 0.1 Hz and 50 Hz.
However, when I plotted the power spectral density graphs using Welch’s method for recordings across all four tasks, the anomalies became even more obvious.


Firstly, the data points exhibit unusually large values on the y-axis. Typically, a normal PSD graph has an upper limit of around 100 on the y-axis, whereas the graphs based on the erroneously collected EEG signals have an upper limit close to 107. Secondly, the graphs display an unnatural, repetitive zig-zag shape in most of the plots. Thirdly, the plots for all four tasks shared a common feature. For EEG signals collected during the “No music” and “English” time windows, the plots show a spike for frequencies of around 20 Hz. For EEG signals collected during the “Chinese,” “Japanese” and “Instrumental” time windows, the plots remained relatively flat around that frequency.

Considering the possibility that these spikes resulted from errors in my code for plotting the graphs, I utilized the OpenBCI GUI software to replay the recordings and observed FFT plot patterns for these two groups. The observations align with the patterns in my own plots, with spikes observed at frequency of 20Hz only for the “no music” and “English songs” conditions.

While this interesting pattern may suggest a correlation between the languages of music and my brain activities, its obvious and consistent presence across all four tasks raises the possibility of a systematic error induced by external factors, such as the DC current. Therefore, although the erroneously collected data displays some patterns in its PSD graphs, it is insufficient for evaluating the impact of music written in different languages on my levels of focus during tasks requiring concentration.
Methods: The Second Iteration
In the second iteration of the experiment, I redesigned the data collection process.
I kept the list of music used in the first iteration and rearranged them in the following order. This is to reduce the effect of order on the experiment results.
| Title | Artist | Duration | Language | Spotify Link |
| Questions For The Universe | Laufey | 3:24 | English | https://open.spotify.com/track/7kle3wveNJelYdI1khvHDb?si=a2dee201f6d04b… |
| 我等的那个人 | Xing Zheng | 3:59 | Chinese | https://open.spotify.com/track/36sqsukwpzgDjrBW6fOL2P?si=7f58a66caf644f… |
| カタオモイ | Aimer | 3:27 | Japanese | https://open.spotify.com/track/2HovXsvcdJur52BOcYGydz?si=054c7b941f2d4f… |
| Yumeji’s Theme | Shigeru Umebayashi | 2:30 | Instrumental | https://open.spotify.com/track/0yVq58uQ2Bp2OVADYlLHNk?si=6398f9eb719e40… |
| 9 Crimes | Damien Rice | 3:39 | English | https://open.spotify.com/track/08YEGpKt2LHJ0URCXKHEie?si=931fe81258914b… |
| 心动 | Kit Chan | 3:51 | Chinese | https://open.spotify.com/track/2DglkgKB5UlwrCdwcHZjXE?si=fef8eb173c844b… |
| YASASHISA | Fujii Kaze | 4:00 | Japanese | https://open.spotify.com/track/57u1FaZlztApkcT5x5XNuD?si=d7dde4d593f74e… |
| Gymnopedie No.1 | Erik Satie, Mimosa | 3:39 | Instrumental | https://open.spotify.com/track/16AtEuLpkzUg1BLSugpHE6?si=e59d234bdfc945… |
For the baseline condition where no music is played in the background, I changed it to a 12-minute time window divided into 3 sections.
| Section Number | Duration | Condition |
| 1 | 2 mins | Eyes closed, relaxed |
| 2 | 2 mins | Eyes open, relaxed |
| 3 | 8 mins | Eyes open, start working on task |
In my analysis for the baseline, I further divided Section 3 into 4 subsections of 2 minutes. For each subsection, I plotted a power spectral density graph. Then I observed the changes in EEG power across Section 1, Section 2 and the 4 subsections of Section 3 through the 12-minute time window.
Below is an example plot for baseline analysis.

In the second iteration, I performed the following tasks.
| Task | Language | Detail |
| Reading a novel | English | The Underground Railroad by Colson Whitehead |
| Solving Leetcode coding problems | English, Java | All problems have a difficulty level of “Easy” |
| Writing an essay | English | Writing the first half of this project report |
| Reading a novel | Chinese | Brothers by Yu Hua |
Data Analysis 1: Leetcoding in English
I plotted the EEG signals for the entire recording. Based on the graph below, except for a few exceptions that are possibly noises, the data collected in the second iteration has magnitudes within a reasonable range.

Then I plotted the following graph for baseline analysis. Since all three channels have nearly identical patterns in their plots, in this report, I only included graphs generated using data collected through Channel 0.

The graph illustrates that as soon as I started working on the Leetcode problems, the power densities of Delta, Theta, Alpha, and Beta bands all experienced an uptick. A noticeable upward trend is observed in the Theta, Alpha, and Beta bands as time progressed, indicating an increase in concentration as I delved further into solving the problems. The gradual increase is most obvious in the Beta band. This observation aligns with Lim S., Yeo M. and Yoon G.’s claim that Beta waves are related to “active thinking, active attention, and solving problems.”
During the recording, I observed that whenever an eyeblink occurred, the FFT plot on the OpenBCI GUI displayed a sharp increase across the Delta, Theta, and Alpha bands. Since I did not filter out the eyeblink noises from the raw data, it is likely that these noises contaminated the EEG signals in these three frequency bands. Consequently, for the Leetcode task, I decided to use Beta waves as a more reliable indicator of my concentration level.
Then I plotted the following PSD graph.

For the Leetcoding task, the PSD plots for various music conditions appear remarkably similar, showing no discernible trends. This observation resonates with my personal experience while working on Leetcode problems — I did not encounter significant distractions or fluctuations in my focus level over time, even when the music changed from one to another.
The consistent attention could be attributed to the nature of solving programming problems, which typically involves minimal processing of text information. Additionally, the use of the Java programming language, distinct from the languages in the song lyrics, might have minimized the influence of lyrics on my thinking and contributed to this sustained focus.
Data Analysis 2: Writing in English
I plotted the EEG signals for the entire recording. Based on the graph below, except for a few exceptions that are possibly noises, the data collected has magnitudes within a reasonable range.

Then I plotted the following graph for baseline analysis.

The baseline plot for the English writing task exhibits similar patterns to the one for the Leetcoding task. Upon starting the writing process, there is a noticeable increase in the power densities of the Delta, Theta, Alpha, and Beta bands. An upward trend persists in these bands as time advances, signaling a gradual rise in concentration throughout the writing task. Drawing parallels with the Leetcoding task, I decided to use Beta waves as an indicator of my concentration level for the English writing task, given similar considerations.
Then I plotted the following PSD graph.

In contrast to the Leetcoding task, the writing task displayed more pronounced differences in the plots for various music conditions. It remains unclear whether these variations are language-related. For instance, in the Beta waves, Instrumental 2 shows the highest power density, while Instrumental 1 has a relatively low value. Chinese 2 has the lowest power density, whereas Chinese 1 falls into the medium range. Nevertheless, noticeable fluctuations occurred during transitions between different music types. This could be attributed to the nature of the writing task—working on a project report meant that different sections required varying levels of thought, resulting in fluctuations in my concentration levels.
Data Analysis 3: Reading in English
I plotted the EEG signals for the entire recording. Based on the graph below, except for a few exceptions that are possibly noises, the data collected has magnitudes within a reasonable range.
Then I plotted the following graph for baseline analysis.

This baseline plot differs from the previous two. In the initial 2 minutes of reading, the PSD values are the highest across almost all frequencies, followed by a drop after 2 minutes, with a gradual increase afterward. Despite a general trend of increase after the initial 2 minutes, a good amount of fluctuations occurred within the 2-8 minute timeframe. This strange pattern may be due to my personal habit when reading texts in English, where I tend to concentrate better at the very beginning and lose focus after a while.
Since there is still an increase in PSD values in the Beta range when I switched from the “No music: eyes open, relaxed” condition to the writing condition, for this task, Beta waves may still be used as an indicator of my concentration level.
Then I plotted the following PSD graph.

Before the experiment, I hypothesized that English lyrics would result in the most distraction when I read texts written in English. The PSD graph above shows that this may not be the case. Looking at the Beta frequencies in the graph above, I observed that the plots for English 1 and English 2 exhibit PSD values above average. The variations of PSD values across different music conditions are, again, not obviously language-related. For instance, in the range of Beta frequencies, Instrumental 2 shows the highest power density, while Instrumental 1 has a relatively low value. Chinese 1 has the second highest power density, whereas Chinese 2 falls into the medium range. These seemingly random patterns could be attributed to my tendency to experience wandering attention when reading English text.
Data Analysis 4: Reading in Chinese
I plotted the EEG signals for the entire recording. Based on the graph below, except for a few exceptions that are possibly noises, the data collected has magnitudes within a reasonable range.

Then I plotted the following graph for baseline analysis.

In the range of Beta frequencies, an upward trend in PSD values is observed as time advances, signaling a gradual rise in concentration throughout the reading task. Therefore, for this Chinese reading task, I picked Beta waves as an indicator of my concentration level.
Then I plotted the following PSD graph.

When examining the Beta wave plots representing different music conditions from bottom to top, I noticed that their order closely mirrors the order of the playlist. This observation suggests that during the reading task in Chinese, my focus level increased as time progressed, and I was not easily distracted by the switch of background music. This aligns with my hypothesis that my mastery or familiarity with my first language helps me stay focused when performing tasks demanding concentration, irrespective of the languages of background music.
Conclusion
In conclusion, the impact of background music on my concentration levels varies across different tasks. For programming tasks, the language of the background music appears to be an insignificant factor due to the distinct nature of programming languages compared to human languages used in music lyrics. On the other hand, when engaged in writing tasks in English, the specific content being worked on emerges as a more influential factor on my concentration levels than the language of the background music.
Interestingly, the distraction I experience while reading English text seems to be more linked to my unfamiliarity with the language itself. This is evidenced by fluctuations in my concentration levels even without the interference of background music. While the languages of music may play a partial role, their impact cannot be conclusively determined based on this experiment. Lastly, for reading tasks in my first language Chinese, the languages of the songs I listen to play a relatively minor role in affecting my concentration levels.
Reference
- Lim S, Yeo M, Yoon G. Comparison between Concentration and Immersion Based on EEG Analysis. Sensors (Basel). 2019 Apr 8;19(7):1669. doi: 10.3390/s19071669. PMID: 30965606; PMCID: PMC6479797.
- You, S.D. Classification of Relaxation and Concentration Mental States with EEG. Information 2021, 12, 187. https://doi.org/10.3390/info12050187
Course
Info 290T. Biosensory Computing , Fall 2023