

 Saxenian")


Marine Microplastics
Problem & Motivation
As awareness about microplastic pollution rises, consumers and health organizations are becoming increasingly concerned about the potential health risks posed by consuming fish contaminated with microplastics. Studies have shown that microplastics can accumulate in fish tissue, potentially passing through the food chain to humans. However, consumers lack an easy way to assess whether the fish they purchase contains high levels of microplastics. Currently, there is no readily accessible tool that provides this information based on real-time or historical environmental data. That is where we come into play!
Data Source & Data Science Approach
Our Datasets
Our project relied on data from three sources to create our interactive tool:
- CYGNSS Dataset: Satellite imagery of microplastic concentrations across the entire ocean that has been updated daily since 2018. The data is limited from -37 to 37 degrees latitude but surrounds the entire equator.
- Matthew Savoca Research Data: A research paper culminating over 100 separate studies around the microplastics found in the guts of fish across the world. This data helps us to drive the training of our models.
- Longhurst Provinces: A set of longitudinal and latitudinal data that outline major fishery provinces of the oceans. This data helps drive the interactive map provided on the Marine Microplastics tool.
Future iterations of the tool would ideally include data from AquaMaps, an interactive dataset outlining the geolocations of different fish species worldwide. Using this,
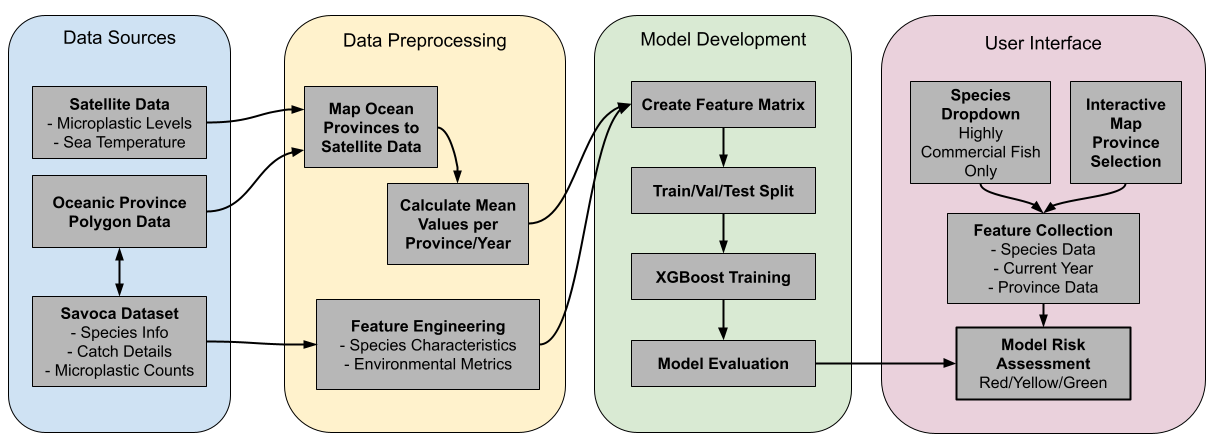
Data Pipeline
The graphic below depicts our data pipeline used to solve this problem. The oceanic province polygon data is used to connect the Savoca dataset with the CYGNSS satellite data. The polygons are mapped onto the satellite data and aggregate calculations are taken for each region for each time frame (daily). We can then calculate the area under the curve for each catch for 1 year, 2 years, and 5 years leading up to the time caught. This allows us to augment the model training data with satellite data. Other feature engineering is done prior to training, including classifying the mean number of microplastics into risk categories representing no risk, low, risk, and high risk. We train an XGBoost model. After evaluation, we use this model to predict the risk group.
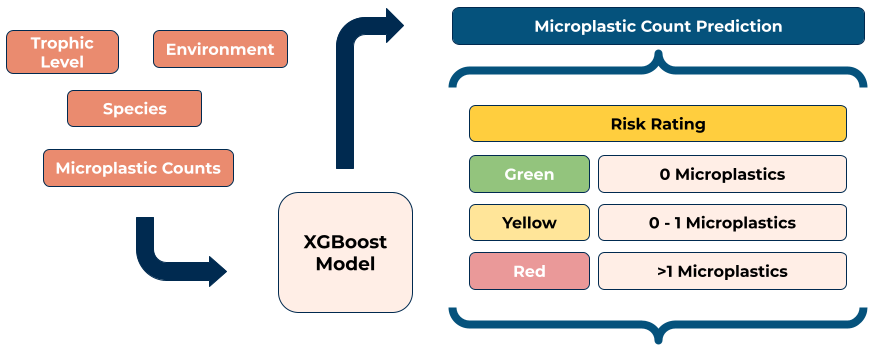
Modeling
As discussed, we trained and evaluated an XGBoost model to ultimately predict risk of microplastic contamination in highly commercial fish species commonly consumed. The model architecture is represented in the image below.
Along with our XGBoost model, prophet modeling was done on each oceanic province to backfill the dataset for fish that were caught before 2018, which is where our satellite data begins.
Evaluation
To evaluate our microplastic risk prediction model, we look at precision, recall, and F1-score of each risk class, as well as overall accuracy. Ultimately, our two lower risk classes have much better performance than the high risk group. The overall accuracy for our final model is 75%.
Future Work
Despite the strides made to connect the various pieces of research related to bioaccumulation of microplastics in fish species and bring more insights to consumers, we believe this project only scratches the surface of what is possible from a tool like this. The following list represents our anticipated future work on the topic:
- Implementing the use of AquaMaps data to more accurately pinpoint where fish are to ultimately overlay with satellite data.
- Gather data regarding fish species lifespan and incorporate into calculation of relevant satellite data features such as sea temperature and microplastic exposure.
- Incorporate multi-modal modeling practices. Utilize other models such as a KNN model.
- Incorporate barcodes data for consumer ease of use.
Key Learnings & Impact
Key takeaways from our work include the following:
- More research and data transparency surrounding microplastic bioaccumulation in fish will be the key to gaining better insights regarding our food safety.
- Keeping a simple interface with very clear and easy to access interactive widgets allows users to not only explore fish relevant to them, but fish from other parts of the world.
- Our tool can be used to bring awareness to the issue at hand and garner support from groups that can assist in strengthening data transparency needed to strengthen the model.
Acknowledgements
We would like to send a special thank you to the creators of the data sets we utilized, researchers of the ocean, Zona and Todd from Section 2 of the W10 class, and our wonderful classmates who supported us along the way!
Citations
Savoca, M. (n.d.). Plastic ingestion by marine fish is widespread and increasing. Global change biology. https://pubmed.ncbi.nlm.nih.gov/33561314/
Course
Data Science 210. Capstone , Fall 2024